Measuring placemaking ROI on the owner's own ledger
By Tully Zeitlin · Published
Placemaking ROI is measured on the numbers the owner already runs the property on: visits, dwell time, food and beverage, tenant sales, leasing and renewals, read on programmed days against the days without. That is the whole method. It needs no model, no survey vendor and no new dashboard, only the reports the property already produces and a calendar consistent enough to compare against. This page explains which numbers to read for each kind of property, how to set up the comparison, and which numbers usually move first. What placemaking is, and why so much of it stops at the ribbon cutting, is on our guide to placemaking.
Why placemaking ROI is an operating question, not a marketing one
The economics land on your P&L, not just a marketing line. Increased traffic. Longer dwell times. Higher sales per square foot. Stronger tenant retention. Higher rents. Faster leasing. Renewed community relevance. That is what the experience layer is for. Every one of those is a line the owner already reports, which is why the return on programming can be read without inventing a metric for it.
The reason most owners cannot read it today is not the data. It is that the calendar is too thin to compare. Three events a year leave nothing to measure. A weekly rhythm people can count on, monthly anchors that spike traffic, and seasonal tentpoles that put a place on the map give the property dozens of programmed days a year, and dozens of programmed days are a sample.
The numbers that measure placemaking, by property type
The benefits of placemaking show up on different lines for different owners, and the measure follows the ledger.
Mixed-use developments. Visits, dwell, tenant sales, residential and commercial leasing velocity, renewals and rents. Faster lease-up and absorption, higher rents, lower tenant and resident churn.
Retail and lifestyle centers. Traffic, dwell and tenant sales per square foot, and differentiation when every center is fighting for the same consumer. Retail foot traffic on a programmed Thursday against an ordinary one is the cleanest single read a center has.
Hotels and resorts. Non-room revenue, rate support and food and beverage traffic from non-guests.
Office owners. Leasing, retention and the health of the ground-floor retail.
Multifamily. Renewal rate, rent growth and per-door performance.
Cities and downtowns. Residents who stay in town nights and weekends, visitors from beyond the neighborhood, and the tax revenue that events increase.
Reported against the numbers you already run on: visits, tenant sales, leasing and renewals. Measured, not modeled.
How to set up the comparison
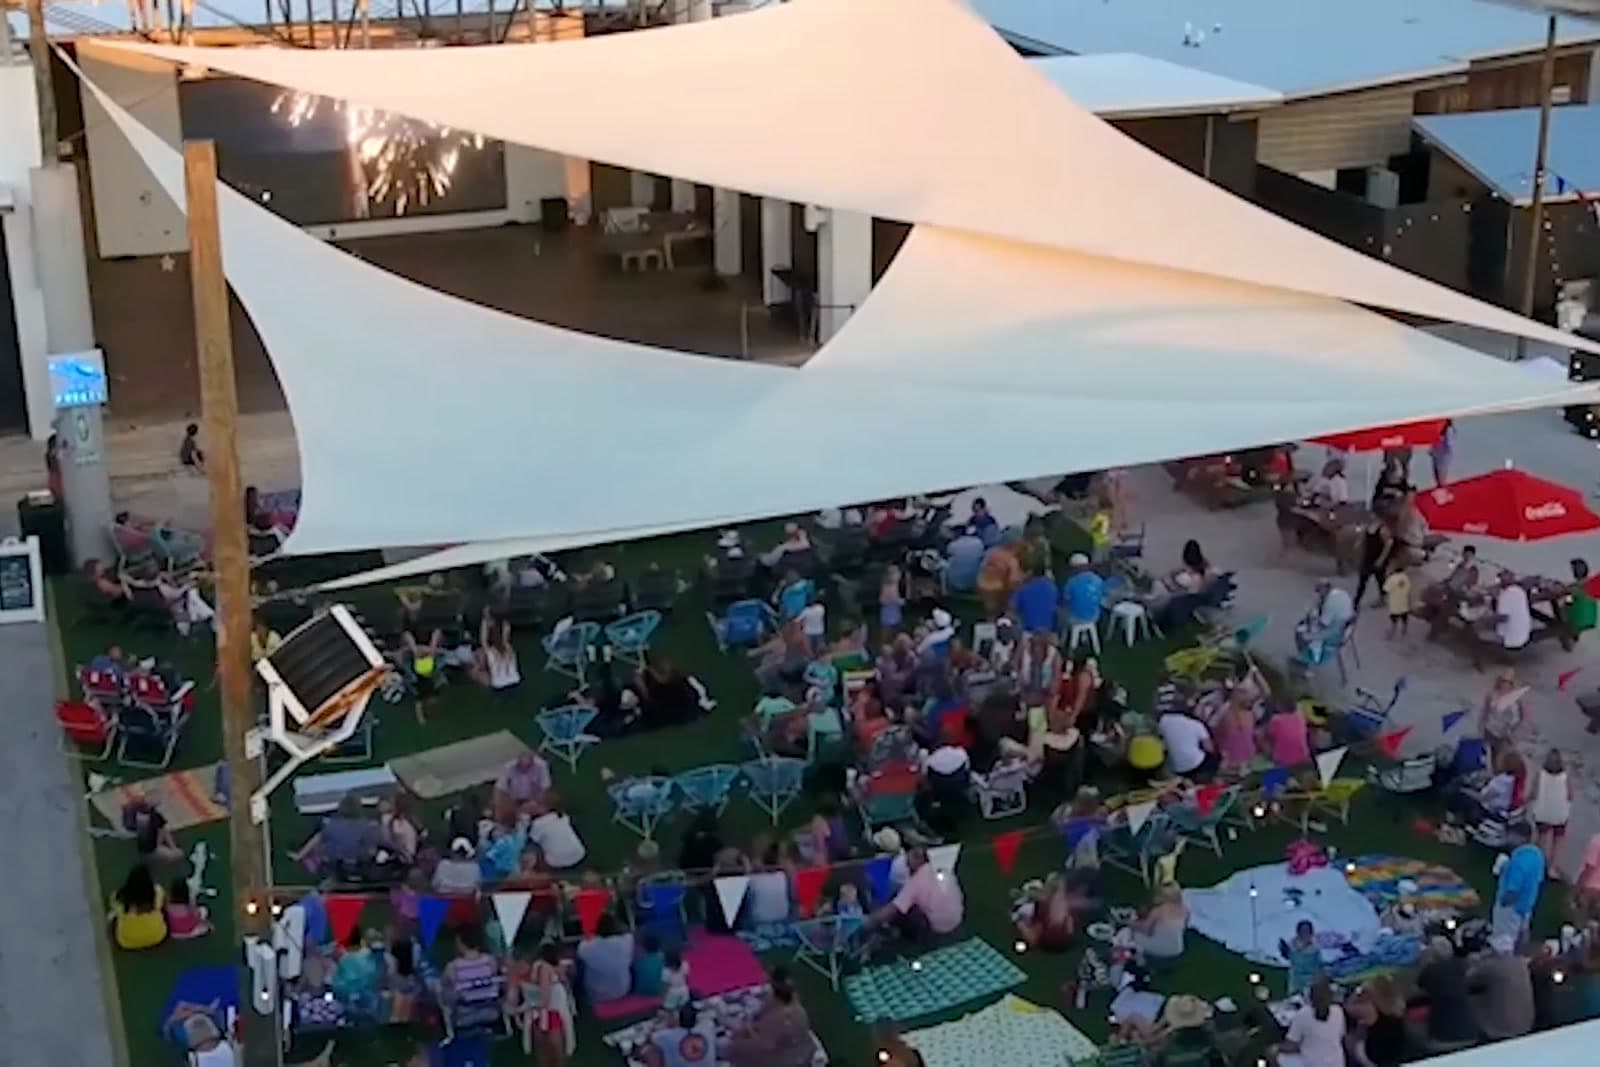
At our own venues the measures were traffic and sales: orders and receipts on programmed days against the days without. The setup is the same anywhere.
Pick the programmed days before the season starts. The calendar is the treatment. Write it down a quarter ahead so the comparison is not chosen after the fact.
Pair each programmed day with its comparable. The same weekday, the same month, no event, the same weather where you can. A music Thursday is compared with a quiet Thursday, not with a Saturday.
Pull the reports the property already runs. Tenant sales reports by day where the leases provide them. Point-of-sale receipts and covers from the restaurants and bars. Door counts or parking counts where the property has them. For visits and dwell at the property level, the location-analytics vendors that estimate foot traffic from mobile devices are a reasonable read for a center or a district, with the caveat that they estimate rather than count.
Read the gap, then read the trend. The gap on programmed days against comparable days is the first number. The second is whether the ordinary days rise over the year, which is what a habit looks like in the data: people who came for the music on Thursday come back on Tuesday without one.
Ask the tenants. After each event, the follow-up call to the tenants asks one question, did it work for you? Their answer is a number too, in covers and in renewals.
Track the list. The growth of your own list, on email, text and social, is the one asset that compounds from event to event and the one channel the property owns outright.
Which numbers move first
The programmed-day gap shows up first, usually in food and beverage, because a full patio is counted that night. Dwell and visit frequency move next, once the weekly rhythm is steady enough for people to plan around it. Tenant sales follow the traffic. Leasing, renewals and rents move last, because they turn over on lease cycles, and they are the numbers an owner values the property on. Programming that stops before the rhythm becomes a habit never reaches them, which is the most common way to spend the money and miss the return.
Who measures it
Whoever runs the calendar should own the report, because the report is what tells the calendar what to keep. We plan, book, and produce, and we report each season against the numbers you already run on. Whether that beats building the department in-house is the question we answer in in-house or outsourced event programming, and the five phases that end in Measure are on how event programming works. Mixed-use owners start with our page for mixed-use developments, and center owners with retail and lifestyle centers.
Frequently asked questions
How do you measure placemaking?
On the numbers the owner already runs the property on: visits, dwell time, food and beverage, tenant sales, leasing and renewals, read on programmed days against comparable days without an event, and then as a trend over the year.
What are the benefits of placemaking for a property owner?
Increased traffic, longer dwell times, higher sales per square foot, stronger tenant retention, higher rents, faster leasing and renewed community relevance. Each one is a line on the owner's own ledger.
How do you measure foot traffic?
Door and parking counts where the property has them, tenant sales and restaurant covers by day, and location-analytics estimates from mobile devices for a center or a district. Compare programmed days with the same weekday in the same month without an event.
How do you measure whether events increase tenant sales?
Tenant sales reports by day where the leases provide them, and point-of-sale receipts from the restaurants and bars, on programmed days against comparable days. Then ask the tenants after each event whether it worked for them, and watch renewals.
Which numbers move first?
Food and beverage, usually on the programmed nights themselves. Dwell and visit frequency follow once the weekly rhythm becomes a habit, and tenant sales follow the traffic. Leasing, renewals and rents move last, on lease cycles, and they are the numbers the property is valued on, which is why the calendar has to keep running to reach them.
Does placemaking need a formal economic-impact study?
Not for an owner's decision. A study estimates what an event returns to a region. An owner reads what programming returns to the property, on the property's own reports, and that is enough to decide what to keep.
Get in touch.
Tell us about the property. We listen first, propose what fits, and shape the engagement around what you actually need.